This is an online version of a document prepared for a presentation made at RCCG TLA’s marriage seminar titled “Financial Wisdom: Savings and Investment in Marriage.”
Introduction
NGX and tempting high returns
The Nigerian stock market (NGX) has been producing incredible returns in recent months. If you are active on social media, you have probably heard about some of these feats.
The chart below shows the stocks that have produced the highest 1-year returns in the NSE as of September 16, 2025.
Best Performers by 1-year Returns in the NGX
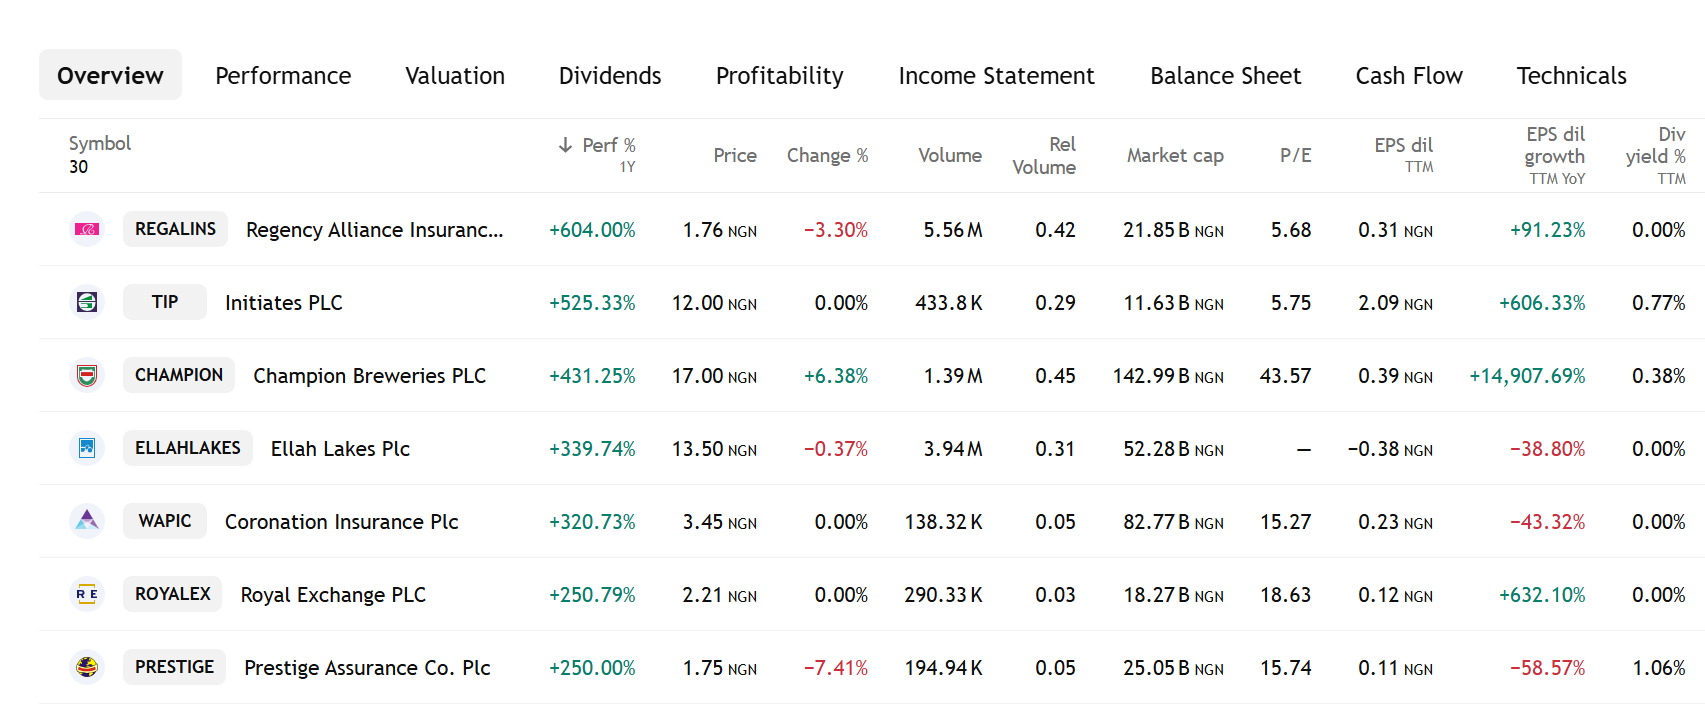
Source: Trading View
If you had bought Regalins for just #100,000 on September 16, 2024, your investment would be worth #700,400 as of September 16, 2025.
We can do the same sort of calculation for all the other stocks in this list.
Imagine holding all 7 stocks that top this list! Suppose you invested #100,000 in all 7. Your #700,000 would now be worth #3,420,000, for an average 1-year return of 389%.
The other side of the story
However, there is an opposite side to this seemingly nice story.
At the opposite end of the spectrum are these eight companies that have posted negative returns over the same 1-year period:
NGX Stocks With a Negative 1-year Return As of September 16
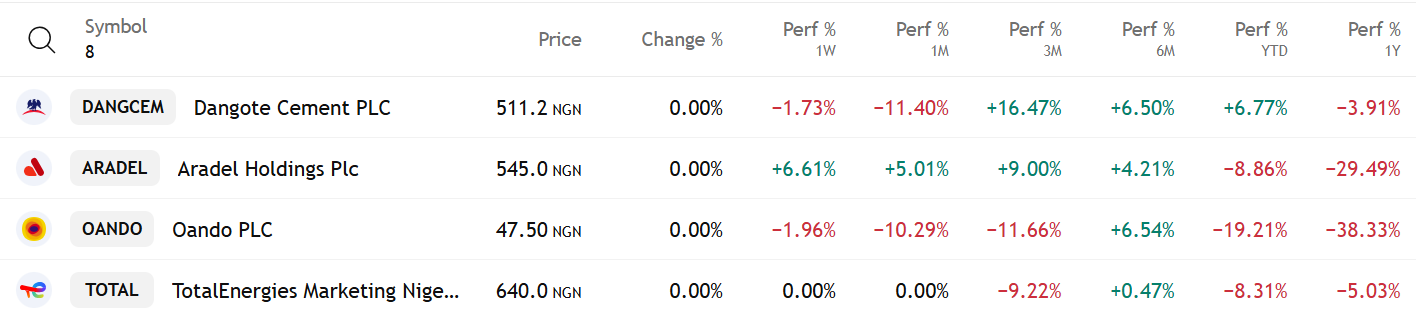
Source: Trading View
A #100,000 investment in Oando a year ago would be worth #61,670 at the time of writing. Similarly, a #100,000 investment in each of these 8 stocks (a total of #800,000) would be worth #671,130, a total return of -16.11%.
This dynamic, where some stocks post high returns and others negative returns within a given short period, exists in all stock markets, including the US market.
Does it then mean that making money in the stock market is a matter of luck?
No!
Section 1: A long-term approach wins
The first point to note is that stock prices are very volatile in the short term. A good company can post negative returns within any given short-term period, while a struggling company posts high returns driven by market sentiments.
It is ultimately in the long run that stock prices tend to reflect the intrinsic value of the companies behind them.
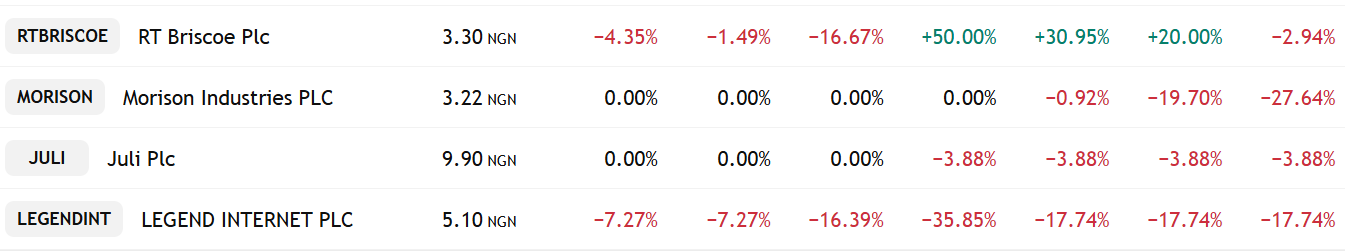
To illustrate, consider the long-term performance of three of the stocks that posted negative returns in the last 1 year:
Long-term Performance of Oando, TotalEnergies, and RT Briscoe
Though Oando’s price has fallen by 38.33% in 1 year, it has risen by more than 2,000% in the past 5 years. A #100,000 investment 5 years ago would be worth #2,372,200 at the time of writing.
We see similar incredible returns for TOTAL and RT Briscoe Plc.
Returns for all three stocks are also positive over 10 years and across all time.
In fact, only 2 of the 8 companies still had negative returns over 10 years and across all time.
The point?
The longer you stay in the market, the lower the probability of losing your money.
This is the conclusion of a study of US stock market data between 1926 and 2019 by Morning Star, an investment research firm in the US. The chart below summarises the study:
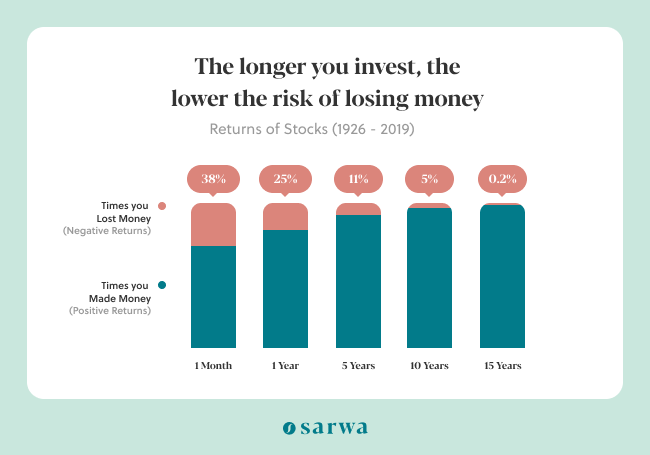
In other words, over the short term, stock investing is riskier as good companies can have temporary negative returns due to some temporary hiccups, general economic conditions, or current market sentiments.
But in the long run, stock investment is less risky because good companies tend to approach their intrinsic value.
Section 2: How money is made in stocks
Though we have focused on how stock prices increase (price appreciation), this is not the only return investors enjoy from the stock market.
The other form of return is called a dividend. This is the portion of the company’s earnings (net income) that they pay to shareholders. Dividends are paid based on the number of shares an investor holds.
For example, if the annual dividend per share of a company is #5 and you own 5,000 shares, you will receive #25,000.
Some key points about dividends:
- Not all companies pay dividends: Some companies prefer to reinvest the money back in the business so they can boost their stock prices. For example, Regalins and Chams Holdings have not paid dividends in the last five years. Some also use the money they would otherwise pay as dividends to buy back shares from shareholders. This reduces the number of outstanding shares and increases their earnings per share (ceteris paribus), making them look more attractive to some investors.
- Not all companies pay dividends regularly: Even when a company pays dividends this year, it may not pay the next year. Said differently, dividend payment is not mandatory.
- A sign of stability: Investors have come to see regular dividend payments as a signal that a company is stable. Thus, they may not buy a company that doesn’t pay them regularly.
Some favourites of dividend lovers in Nigeria include UBA, GTCO, and Dangote Cement.
- Frequency of payments: Companies that pay dividends typically do so quarterly. However, in Nigeria, semi-annual (Access) and annual (BUA Cement, Dangote Cement) payments are more common.
Many investors prioritise dividends for two main reasons.
First, some use dividend payments (depending on the amount) to pay children’s school fees, create an emergency fund, and meet other expenses. Retirees often use them to supplement pension income.
Second, some reinvest their dividends by using them to buy more shares of the same company or other companies. This allows them to further compound their returns through price appreciation.
Section 3: How much money can be made in the stock market?
The next important question is this: How much can you expect to make from the stock market?
Since some stocks may be outliers over a given period (perform very well or perform very poorly), a common way to project possible returns from stock investing is to look at the performance of a stock index.
A stock index tracks or measures the performance of a group of selected stocks. Some indices cover a certain sector (technology, finance, healthcare), a given section of the market, or the entire market.
S&P 500 example
The S&P 500 is the most common index in the US. It tracks the performance of the 500 largest (by market cap) listed companies in the US stock market.
Over a given period, some of the stocks here will do well and some will perform poorly. But the entire index gives a more realistic picture of the health of the stock market and what investors can expect over time.
Based on data from February 1992 to June 2025, the compounded annual growth rate of the S&P 500 index is 10.98%.
CAGR of the S&P 500, 1992-2025
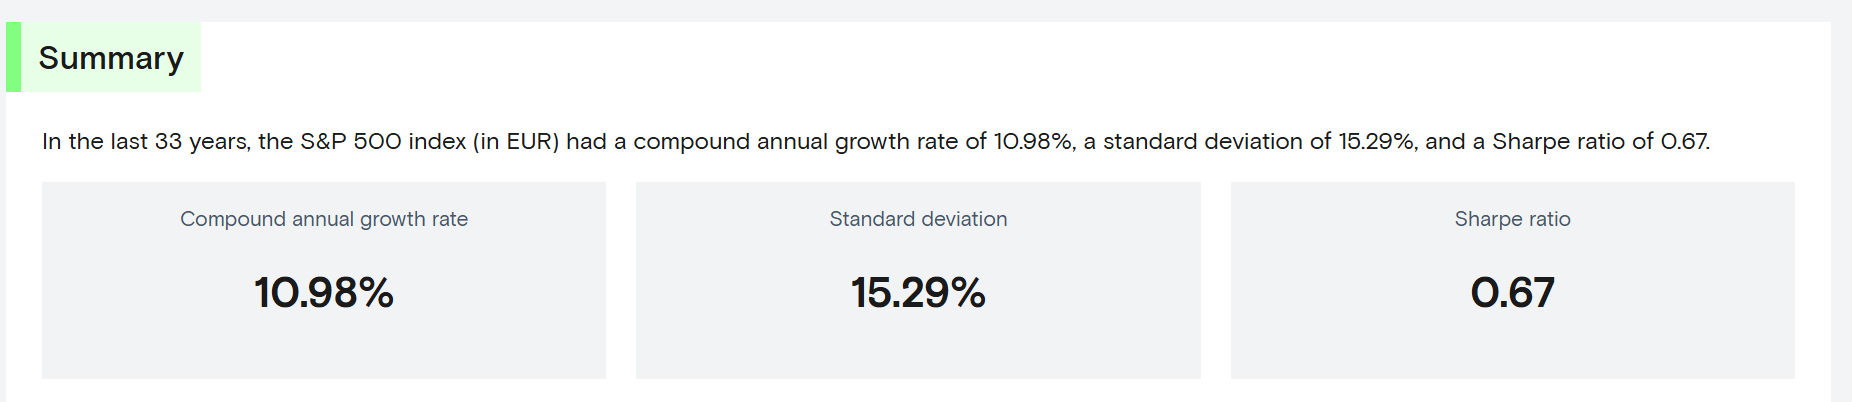
Source: Curvo
If you invest #100,000 in this index and leave it for 10 years, you would have #283,430.91 at the end of the 10th year. That’s extra #183,430.91 for doing nothing.
But what if you keep adding to your investment every month? Let’s say something as small as an extra #50,000 at the end of every month. Well, with annual compounding, you would have #10,801,925.85 at the end of 10 years. Your total contributions would be #6,100,000, and the free money earned would be #4,701,925.85.
Calculator used: https://www.calculator.net/investment-calculator.html
NGX ASI example
But are we not in Nigeria? Does the same thing hold?
From September 2, 2013, to September 1, 2025, the NGX ASI index (which tracks all listed equities on the Nigerian Exchange) grew from 36,585 to 141,698, a compounded annual growth rate of 23.26%.
If you invest #100,000 with annual compounding, you will have #809,508.91 at the end of year 10. That’s extra #709,508.91 for doing nothing.
With a monthly contribution of #50,000 at the end of every month, you would have #20,989,074.88. You would have invested a total of #6,100,000 and earned a total of #14,889,074.88 for free.
As interesting as these numbers are, they are merely the results of passively following the market (more on this later). An index of 500 stocks will have good and bad companies, which combine to provide the 10.98% CAGR result.
But what if you can select only several good stocks from this list and stick to them for the long term? Instead of diluting their good performance with those of other poor stocks in the index, you can have higher returns than the market (generate alpha).
But how do you find these good stocks that can provide you with alpha?
Section 4: How to identify quality stocks
Since a stock is a portion of ownership in a company, a stock can only be good if the company whose ownership it represents is good.
So, the best way to start is to pay attention to your daily experiences as a Nigerian and start taking notes of the companies that provide the goods and services you use or see others use.
Qualitative factors to look out for
But what should you look for? Some qualities common to the best companies, according to Peter Seilern (author of Only the Best Will Do), include:
- Sustainable and scalable business model: A company’s business model is its way of making money; in other words, where its revenues come from.
A retail business, for example, makes money by buying low and selling high. A subscription business makes money from recurring payments. Some companies make money by selling a large number of goods and services at a competitive price, while others make money by selling quality products at a higher price.
The more important point is whether the business model is sustainable and scalable.
Regarding scalability, is the market for its products or services big enough to accommodate its future growth?
Regarding sustainability, do current technological and consumer trends threaten to make that business model irrelevant? Or is it solving a problem that will remain relevant over the years to come?
- Superior industry growth: Is the company operating in an industry that is growing faster than the economy (GDP)? Also, is the industry’s growth stable, or does it follow the economic cycle (expansion, peak, contraction, trough)?
- Consistent industry leadership: Is the company a leader in its industry or a laggard? Also, has it consistently demonstrated this leadership in the past? An example is Google.
- Economic moat: This is also referred to as a durable competitive advantage. It covers all the qualities that confer an advantage on a company and allow it to maintain its market dominance over the years.
An economic moat can be in the form of cost leadership, pricing power, strong brand, proprietary technology, customer loyalty, differentiated products, strong cash flow, and network effects.
Pricing power is especially important as it is often a manifestation of the other forms of economic moat. It refers to a company’s ability to increase its price without losing demand. This allows them to remain steady during economic downturns and inflationary periods.
Apple is an example of a listed company with pricing power, which is a result of its strong brand and customer loyalty.
- Strong organic growth: The company should have experienced strong (greater than GDP growth) and organic (not debt-fuelled) growth in its revenue for several years (Peter Seilern looks for at least 10 years of growth history), including during economic recessions.
This helps to avoid the hype of new companies that produce high growth in one year and then taper off.
- Geographic or customer diversification: The company’s customer base should not be concentrated, as this increases the risk that losing one customer can cripple its revenue. It is also wise to avoid companies that are too exposed to political interference in a given geographic location.
- Low capital intensity and high return on capital: A quality company can use modest capital to achieve a high degree of productivity.
- A solid financial position: A quality company will have low to no debt. This is because future debt servicing will weigh down future earnings, which can drag down stock prices.
- Transparent accounts: The company’s accounts should be audited by trusted auditors.
- Management quality: A good company will have experienced managers who are also shareholders in the business and have the best interests of shareholders at heart.
Most of these characteristics are intuitive. Even if you don’t know how to read a financial statement, some minutes of qualitative research can reveal insights that can indicate that a company will make a good investment.
Quantitative factors to look out for
Interestingly, many of these qualitative factors can also be seen in quantitative terms.
All the information you will need for this analysis can be found on the Stock Analysis platform.
Once you have a company on your radar, you will need to get its stock ticker to complete your qualitative analysis. You can find this by Googling “XYZ stock ticker.” For example, a search for “MTN Nigeria stock ticker” will show that its ticker is MTNN.
If you go to the “statistics” section, you will find some of the relevant information you need.
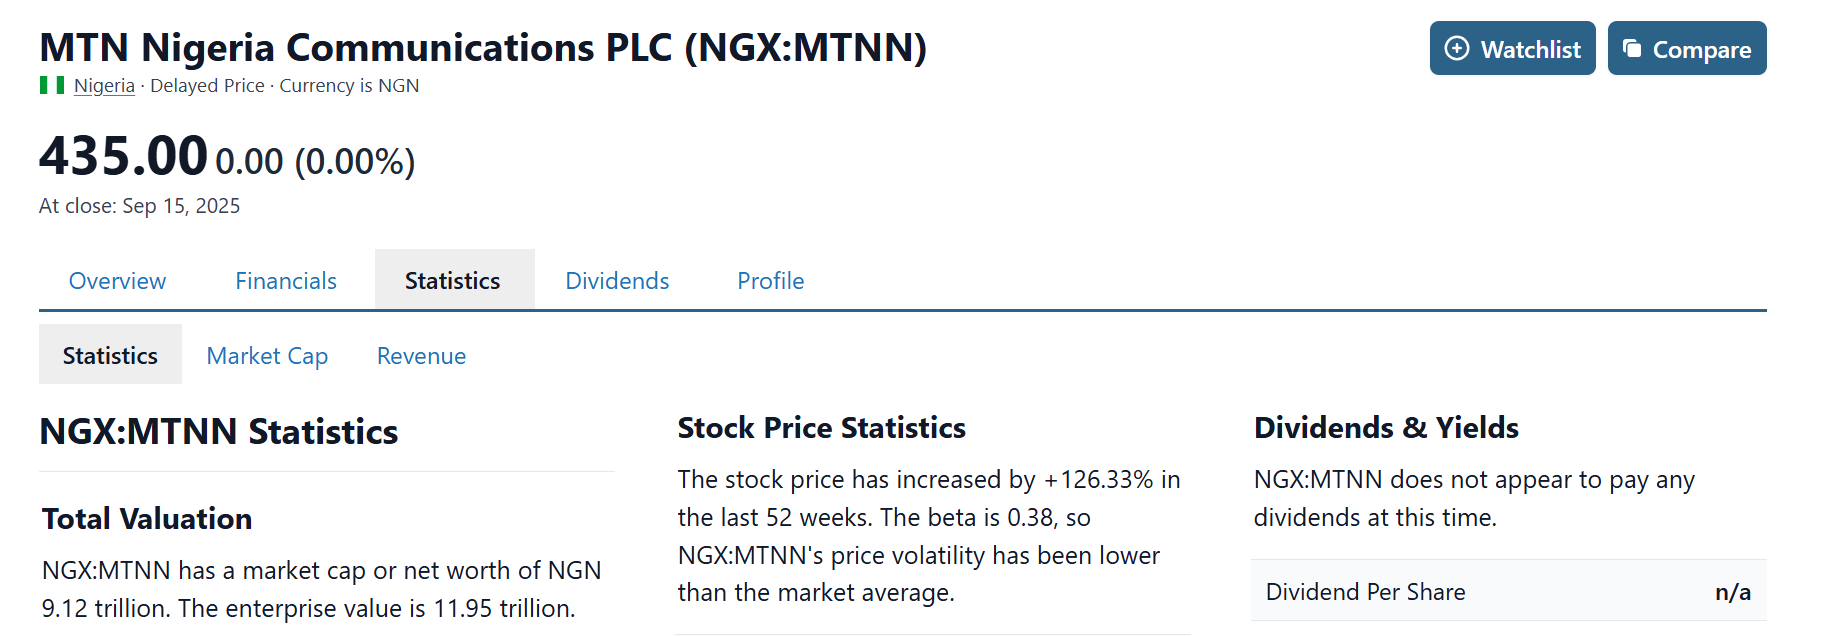
Source: Stock Analysis
The “financials” section will also prove helpful.
Some of the key quantitative measures to look for include:
- High return on equity: This is a measure of how well a company uses shareholders’ funds to generate profits. A figure above 15% will be considered strong, while 10-15% can be decent for capital-intensive industries.
- High return on capital: This shows how well a company uses both equity and debt capital. ROC above 10-15% shows a good use of capital, especially if it’s higher than the cost of capital.
- High profit margins: These include gross profit margins, operating profit margins, and net profit margins. They reveal the company’s cost efficiency and pricing power. A gross margin above 40%, an operating margin above 15%, and a net margin above 10% would be considered healthy, ceteris paribus.
- Stable earnings: Earnings (net income) must experience stable growth over the years. ROE, ROC, and profit margins should also be growing.
- Low debt-to-equity ratio: A low debt-to-equity ratio (lower than 1 in non-capital-intensive industries) shows that the company is stable and can survive economic shocks.
- High current ratio: The current ratio is a measure of the short-term liquidity of a company. A current ratio greater than 1.5 is often desirable, as it shows the company should not have a problem meeting its short-term obligations.
- High quick ratio: The quick ratio considers short-term liquidity if the company does not sell its current stock holdings or rely on prepaid items. That is, it measures how well it can meet its short-term obligations using only cash and receivables. A quick ratio greater than 1 is good.
- Strong free cash flow: A strong cash position means the company can easily handle emergency economic situations and explore fresh investment opportunities without increasing its debt profile.
- High interest coverage ratio: The interest coverage ratio shows how easily a company can pay the interest on its debt. A ratio above 3 is strong, and one between 1.5 and 3 will be acceptable if revenues are stable.
Many investors argue that when you buy a quality company, the price does not matter if you are a long-term investor. This perspective is known as growth investing.
However, there is an alternative strategy known as value investing. This approach also focuses on quality companies, but it seeks to buy them when they are undervalued. A stock is undervalued when its current price is lower than its calculated intrinsic value.
The intrinsic value is subjective, even though it’s calculated using common valuation methods (discounted free cash flow valuation and multiples valuation).
One simplistic method that can give a quick indication of whether a stock is undervalued or overvalued is the PEG ratio.
This is the P/E ratio divided by the estimated future earnings growth. It’s also available on the “statistics” section of Stock Analysis, but different platforms will give different figures. If the PEG is less than 1, the stock is potentially undervalued, and vice versa.
Section 5: Importance of diversification
What if you decide that MTNN, for example, is a quality company? Can you just put all your money on the stock?
Not quite!
When you put all your eggs in one basket, then the loss of that single basket becomes fatal. If MTNN becomes a victim of undesirable management changes, scandal, lawsuits, or creative destruction (NOKIA being an example), you can end up losing a huge part of your investment.
Similarly, putting all your money in one industry (for example, banking and finance) puts you at a big risk since broader macroeconomic shifts and specific industry changes or problems can cause an industry to struggle. For example, after the 2008/2009 global economic crisis, banking stocks in the US did not recover to the pre-crisis level until 2013-2016.
Thus, when buying individual stocks, it is good to spread your tentacles across different industries.
It is also good to diversify geographically. Developed markets like the US provide stability (due to the stability of the economy and the strength of their currencies), while emerging markets like Nigeria can provide higher returns, though less stability. A combination of both can help achieve a desirable risk-return profile.
Diversification across market cap also provides similar benefits. Large-cap stocks (more than #1 trillion market cap in Nigeria; more than $10 billion market cap in the US) tend to be stable, while small-cap stocks (market cap less than #10 billion in Nigeria and less than $2 billion in the US), though unstable, can provide higher returns.
Furthermore, you can reduce risk and improve returns by purchasing other asset classes. On the one hand, you can reduce risk exposure by purchasing assets like bonds and gold. On the other hand, you can increase returns by purchasing bitcoin and, sometimes, Real Estate Investment Trusts (REITs)
Section 6: Passive investing as an alternative approach
We mentioned above that you can pick only quality companies to generate alpha.
However, various surveys have shown that mutual funds (that are managed by financial experts) even struggle to beat the market. Below is the result for the US, according to S&P Global, a global financial firm:
Mutual Funds Performance vs Benchmark Indices in the US
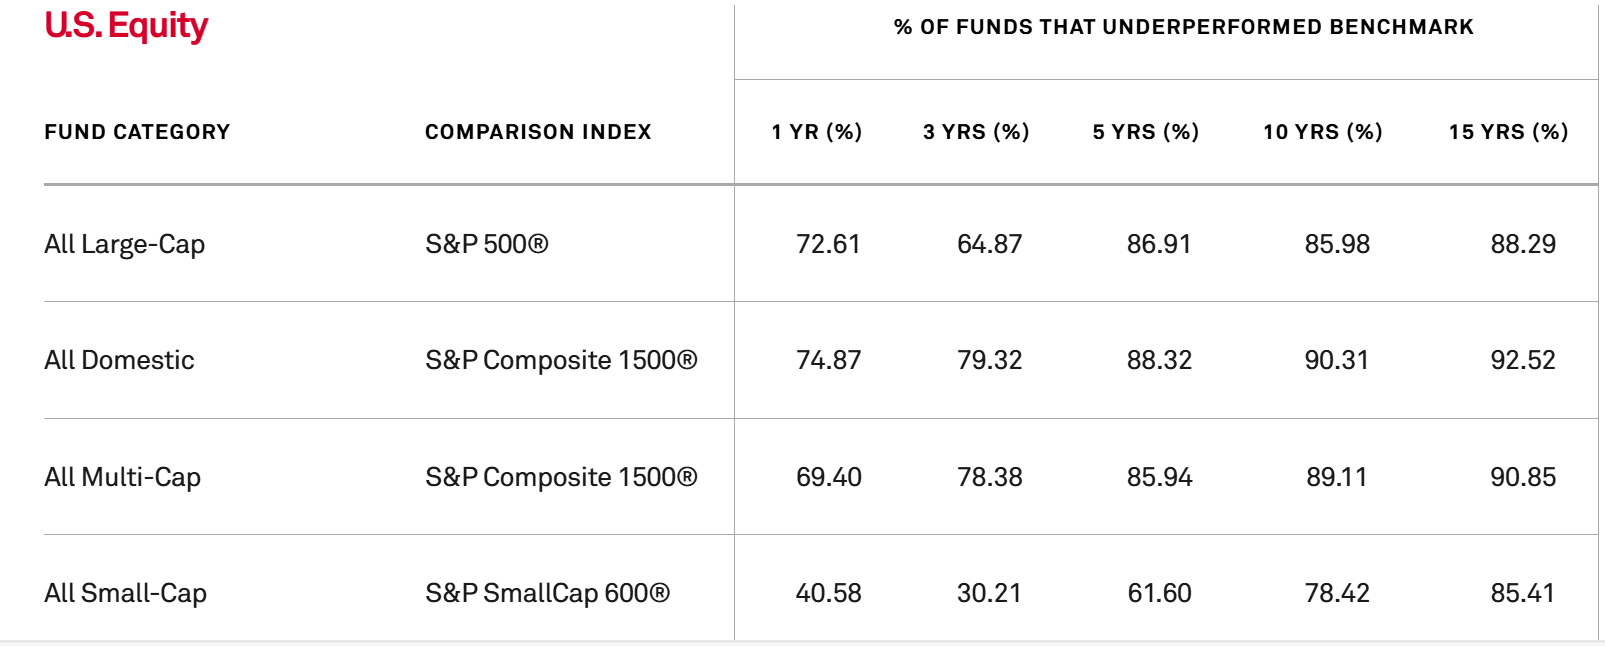
Source: S&P Global
Interestingly, the longer the period of focus, the higher the percentage of mutual funds that underperform, a concerning stat for long-term investors.
Why pay high management fees to mutual funds when most of them end up underperforming?
A more interesting question is this: How can ordinary investors outperform the market when financial experts can’t seem to do it?
“Both large and small investors should stick with low-cost index funds,” advised Warren Buffett.
“Don’t look for the needle in the haystack. Just buy the haystack,” advised Jack Bogle, founder of Vanguard Inc.
“The best investment you can make is in a low-cost S&P 500 index fund,” advised Marc Cuban.
Thus, financial advisors in the US have advised ordinary investors to stick to index funds and ETFs that track broad market indices.
But does this problem of underperformance exist in the Nigerian market?
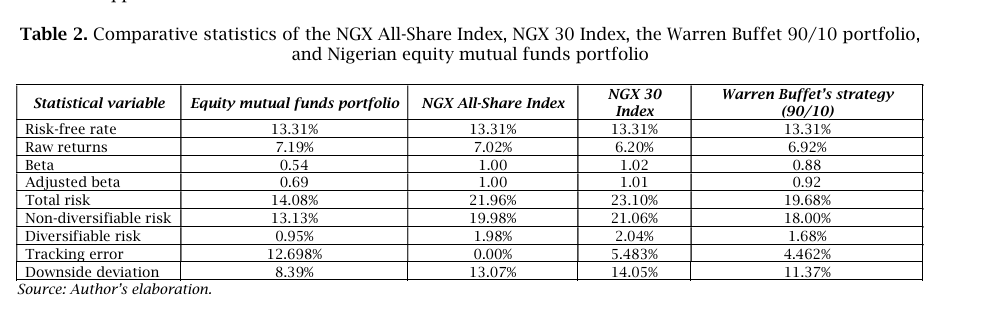
A survey of 30 equity mutual funds between 2012 and 2021 by Adedeji Ajadi of Unicaf University, Zambia, found that they all underperformed (in terms of risk-adjusted returns) both their benchmark indices and a simple passive portfolio (90% in the NGX ASI and 10% in the Federal Government of Nigeria (FGN) 2-year bond).
“Evidence shows that the Nigerian equity mutual fund portfolio does not deliver excess risk-adjusted returns and underperforms the three simple passive portfolios against which it was benchmarked,” he said.
Comparative statistics of an equally weighted portfolio of 30 mutual funds, the NGX All-Share Index, the NGX 30 Index, and the Warren Buffett 90/10 portfolio
Source: Virtus Inter Press
Risk-adjusted returns of an equally weighted portfolio of 30 mutual funds, the NGX All-Share Index, the NGX 30 Index, and the Warren Buffett 90/10 portfolio
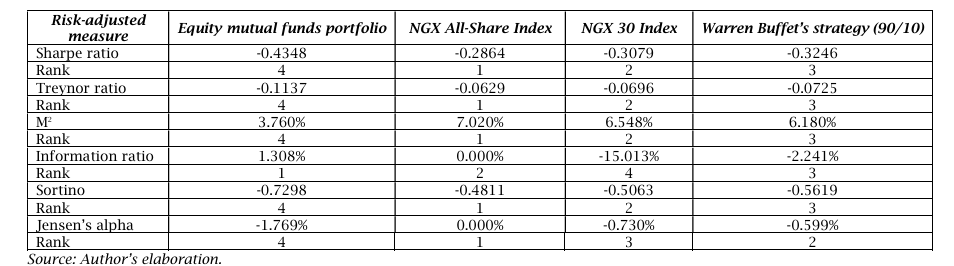
Source: Virtus Inter Press
If we focus on absolute returns (and ignore risk), the portfolio of mutual funds (7.19%) seems to outperform those of the NGX ASI (7.02%), NGX 30 Index (6.20%), and the Warren Buffett portfolio (6.92%).
However, this is only gross returns. With mutual funds charging higher expense ratios than passive funds, net returns will usually end up in favour of passive funds.
Of course, this does not mean that a given mutual fund cannot outperform during a given period. But the mutual fund that outperforms today may underperform next year, and vice versa. It is this consistent outperformance (after factoring in expense ratio and risk) that is difficult to achieve.
Index funds and ETFs
It is for this reason that some investment experts recommend passive funds like index funds and exchange-traded funds (ETFs) to retail investors.
Index funds are passively managed mutual funds; they track the performance of a given benchmark index rather than trying to beat it. So, their returns are almost exactly like that of the underlying index (the little deviation is called tracking error). They do this by buying everything that is in the index and maintaining the weight that already exists in it.
Like mutual funds, they can only be bought or sold at the end of the trading day. However, since they are passively managed, they charge lower expense ratios.
ETFs are also baskets of securities that track the performance of an index. However, they are more like stocks in that they can be bought or sold during normal trading hours, which makes them more liquid.
Similarly, ETFs, unlike index funds or mutual funds, don’t require a minimum investment amount. Most brokerage platforms now support fractional investing – you can buy a fraction of a share of a stock if you can’t afford a single share. For example, AAPL is currently selling for $289. If you don’t have up to that, you can buy just 0.1 share of AAPL for $28.9.
Since ETFs trade like stocks, this feature also applies to them. This makes it easy for low-money investors to purchase them and grow their portfolio over time.
There are many ETFs in the US market. The basic ones that Mark Cuban and Warren Buffett recommend are S&P 500 ETFs. These ETFs invest in all the 500 largest companies in the US instead of trying to select the best ones (like a mutual fund would).
As we saw above, even with just this ETF, you can create wealth if you can wait.
Creating a stock/bond portfolio
However, given that stocks are volatile and risky, it might be better to add some bond ETFs to the basic S&P 500 ETF. But the portion of the portfolio that will be in bonds will depend on your time horizon (how far you are from retirement) and risk tolerance.
Below are some useful guidelines:
| Time Horizon | Risk tolerance | Stocks (%) | Bonds (%) |
| Short (0-3 years) | Conservative | 20% | 80% |
| Moderate | 40% | 60% | |
| Aggressive | 60% | 40% | |
| Medium (3-10 years) | Conservative | 40% | 60% |
| Moderate | 60% | 40% | |
| Aggressive | 80% | 20% | |
| Long (10+ years) | Conservative | 60% | 40% |
| Moderate | 70% | 30% | |
| Aggressive | 90% | 10% |
(Note: These same stock/bond portfolio constructions will work if you go the active investing route. You can buy individual stocks and bonds or stock and bond mutual funds in this ratio.)
US Stock ETFs and bond ETFs are available on Bamboo, Trove, and Risevest.
Some of the popular ones include:
| S&P 500 ETFs | Total US Bond ETFs |
| S&P 500 ETF Trust (SPY) | Core US Aggregate Bond iShares (AGG) |
| S&P 500 Vanguard ETF (VOO) | Vanguard Total Bond Market ETF (BND) |
| ProShares Ultra S&P 500 (SDS) | SPDR Portfolio Aggregate Bond ETF (SPAB) |
| Core S&P 500 iShares ETF (IVV) | Schwab US Aggregate Bond ETF (SCHZ) |
| Invesco S&P 500 Equal Weight ETF (RSP) | Fidelity Total Bond ETF (FBND) |
| SPDR Portfolio Large Cap ETF (SPLG) | |
However, given that an emerging market like Nigeria can provide higher returns than the US market, investing in the Nigerian market alongside the US market can improve the risk-return profile of your portfolio.
Although the ETF market in Nigeria is still underdeveloped, there are enough assets available for passive investors who want to create a stock/bond portfolio.
Three ETFs track the performance of the NGX 30 Index (an index of the 30 largest companies on the NGX): Stanbic 30 ETF (STANBIC), Vetiva Griffin 30 ETF (VETGRIF30), and Greenwich Alpha ETF (GREENWETF). The three are available on Trove.
Meristem also has a growth ETF (Meristem Growth ETF [MERGROWTH]) that tracks the performance of all growth stocks in the NGX ASI Index and a value stock ETF (Meristem Value ETF [MERVALUE]) that tracks the performance of value stocks in the index. Both are also available on Trove.
There is also the SIAML Pension ETF 40 (SIAMLETF40). It tracks the performance of the 40 largest companies (by market cap and liquidity) in the NGX ASI that also possess Pension Funds Administration (PFA) investment eligibility.
Vetiva has a sovereign bond ETF (Vetiva S&P Nigeria Sovereign Bond ETF [VSPBONDETF]) as well as ETFs focusing on specific industries (banking, industrial, consumer goods). While the latter are available on Trove, the former is not currently listed but can be purchased from the company itself. Alternatively, you can invest in individual bond offerings on Trove.
For those interested in gold, the NewGold ETF (NEWGOLD) is an easy way to gain access to the asset class.
Summary of Nigeria’s ETF Market
| NGX 30 Index ETFs | Growth ETF | Value ETF | NGX Pension Index ETF | Bond ETF | Gold ETF | Sector-Focused ETFs |
| Stanbic 30 ETF | Meristem Growth ETF | Meristem Value ETF | SIAML Pension ETF 40 | Vetiva S&P Nigeria Sovereign Bond ETF | NewGold ETF | Vetiva Industrial ETF |
| Vetiva Griffin 30 ETF | Vetiva Banking ETF | |||||
| Greenwich Alpha ETF | Vetiva Consumer Goods ETF |
Let’s look at how to combine US and Nigerian ETFs in a single portfolio.
Suppose you are a long-term moderate investor with a 70/30 stock/bond portfolio. If you invest 50/50 in the US and the Nigerian market, your portfolio will look like the following:
| Asset | Portfolio allocation (%) |
| S&P 500 ETF | 35% |
| NGX 30 Index ETF | 35% |
| US Bond ETF | 15% |
| Nigerian Bond ETF (or individual Nigerian bonds) | 15% |
We have assumed a 50/50 allocation between Nigeria and the US markets. You can tweak this in line with where you are comfortable standing on the stability-high returns spectrum. Another consideration is your view on the path that the exchange rate will take.
If you choose a 60/40 US-Nigerian allocation ratio, for example, the portfolio will look like this instead:
| Asset | Portfolio allocation (%) |
| S&P 500 ETF | 42% |
| NGX 30 Index ETF | 28% |
| US Bond ETF | 18% |
| Nigerian Bond ETF (or individual Nigerian bonds) | 12% |
Simple stock/bond portfolio vs broadly diversified portfolios
Though we have focused on stock/bond portfolios, many variations of them seek to include assets like bitcoin (to increase returns), gold (to protect against economic downturns), and real estate investment trusts (mainly for regular income). Some will also include emerging market equities and bonds (for higher returns) as well as low-cap stocks, among others.
Below is an example of what this more complex portfolio would look like for a conservative investor:
Expanded Portfolio for a Conservative Investor
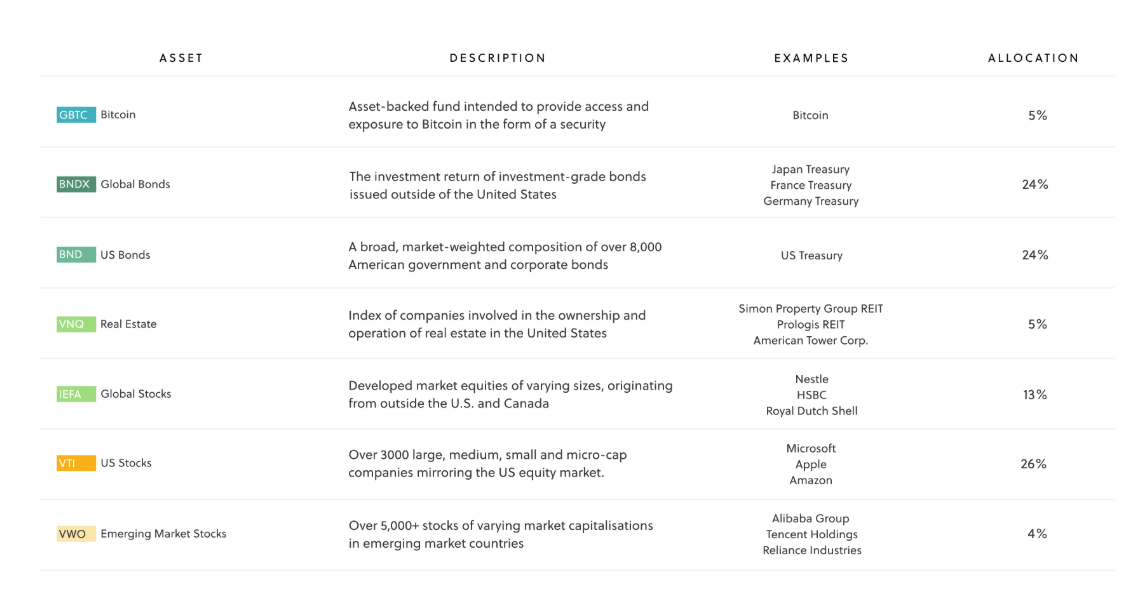
Source: Sarwa
Interestingly, the basic stock/bond portfolio has historically outperformed the more complex and broadly diversified portfolio.
In 2023, a 60/40 stock/bond portfolio produced higher risk-adjusted returns than a broadly diversified portfolio (20% in larger-cap domestic stocks; 10% each in developed- and emerging-markets stocks, Treasuries, core bonds, global bonds, and high-yield bonds; and 5% each in small-cap stocks, commodities, gold, and REITs.), according to a study by Morning Star.
60/40 Stock/Bond Portfolio vs a Broadly Diversified Portfolio in 2023
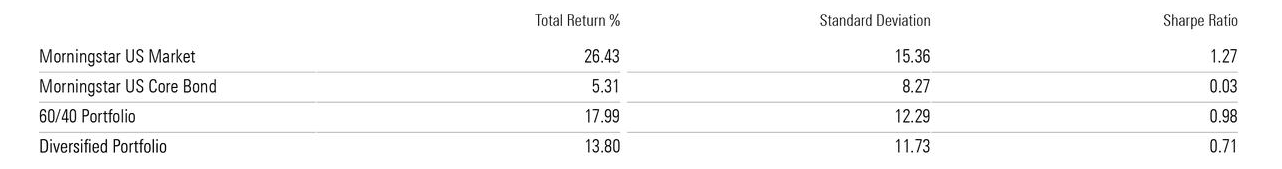
Source: Morning Star
They noted the same trend over the past 3,5,10,15, and 20 years:
60/40 Stock/Bond Portfolio vs a Broadly Diversified Portfolio Over the Long Term
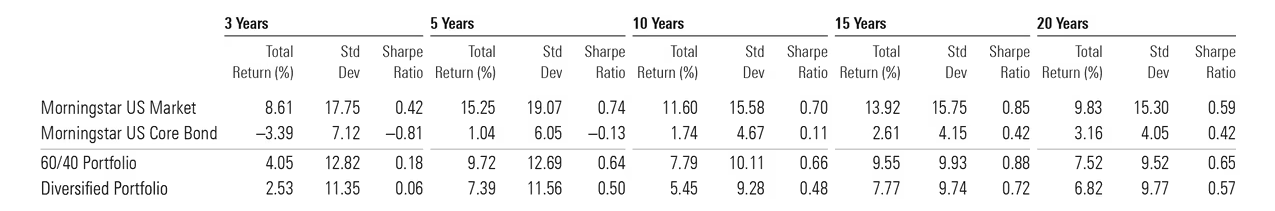
Source: Morning Star
In essence, sticking to a stock/bond portfolio, though simple, can make more financial sense.
What can we conclude, then, about passive and active investing?
Below are the key points:
| Passive Investing | Active Investing |
| Simpler, more hands-off approach
|
Requires investment research skills and time when done individually
|
| Does not require much investment research skills
|
It can be costly when done individually or through a mutual fund
|
| Low-cost approach.
|
History of underperformance of benchmark indices
|
| Often results in higher gross, net, and risk-adjusted returns than active strategies
|
Outperformance is hard but possible. Consistent outperformance is especially hard, but not impossible |
| Can be executed with a simple stock/bond portfolio
|
Can be executed with a simple stock/bond portfolio
|
Summary
For long-term investors, the stock market is a good place to create wealth. The longer you stay in the stock market, the greater the probability that you will make money and the lower the probability you will lose it.
However, it is necessary to select quality stocks that represent ownership in quality companies.
These are companies that are market leaders in growing industries, possess a durable competitive advantage, and have a sustainable and scalable business model. They also have little to no debt, a strong free cash flow position, a high return on capital, a history of strong earnings growth, resilience across market cycles, a diversified client base, competent and shareholder-friendly management, and transparent accounts.
Many of these qualities will also be evident in the profitability, solvency, and liquidity ratios of these companies.
For growth investors, owning these companies is more important than the entry price. However, value investors will still love to buy quality companies when they are undervalued. But valuation is a subjective process, and timing the market can make one lose out on the benefits of spending time in the market.
In reality, selecting the right stocks involves careful research that many don’t have the time or skills to do. For this reason, they prefer to buy mutual funds instead.
However, in recent years, research has shown that mutual funds have a reputation for underperforming their benchmark indices in terms of gross returns, net returns, and risk-adjusted returns.
As a result, experts are recommending passive investing strategies where investors regularly put money in index funds or ETFs that track the performance of benchmark indices. This strategy is generally simpler, cost-effective, and usually provides higher net and risk-adjusted returns.
Beginner investors interested in passive investing can start by purchasing a combination of equity and bond ETFs in Nigeria and the US through platforms like Trove, Bamboo, and Risevest.
However, those who have the skills and time to attempt to beat the market can build a diversified portfolio of quality Nigerian and US stocks on the same platforms. They can combine this with some exposure to Nigerian and foreign bonds to reduce risk exposure.
Conclusion
When it comes to stock investing, two things are especially important: starting early and staying consistent.
Due to the nature of compound returns, the earlier you start, the more returns you can generate over the long term.
In the example above, we saw how starting with #100,000 and topping it up with #50,000 every month can result in a portfolio of #20,989,074.88 by the end of year 10. Let’s assume the start date is 2025 and the end date is 2035.
What if you started in 2027 instead (2 years late)?
At the end of 2035, you would have $12,842,795.69.
But that’s not the interesting part.
The difference between these two figures is #8,146,279.19, but the difference in your actual contribution is just #1,200,000 (#6,100,000 – 4,900,000). Which means the remaining difference of #6,946,279.19 is due to compound returns. Two years can indeed make a lot of difference!
Finally, it is important to stay consistent. You can amplify the power of compound returns through regular monthly contributions to your stock portfolio. And it is also important to stay invested and avoid liquidating your account.
To achieve this, ensure you have an emergency fund of at least six months of your living expenses (what you spend on needs and wants for a month). This will ensure you don’t have to stay out of the market when emergencies arise.


0 Comments